Getting Started
Explore our IT services: innovative solutions, cutting-edge technology, and expert support to transform your business digitally.
- Home
- Getting Started
Getting Started
How to get a VisoraReport trial?
VisoraReport offers a free personal trial, giving you access to a full-featured desktop designer and a local report server for up to 2 concurrent users. Ready to explore advanced business capabilities? Schedule a 30-minute demo with our experts and receive a customized quote tailored to your organization’s needs.
Steps to Experience VisoraReport
- Complete the trial application to receive your activation details.
- Download and install the VisoraReport package.
- Enter your activation code to begin your free trial.
5 steps to create a report in VisoraReport
VisoraReport offers three powerful report creation methods, enabling users to design over ten types of reports. Let’s explore how to create a standard report to see VisoraReport in action.
The following content won’t fully equip you with the skills to master VisoraReport. For more in-depth guidance, you can refer to the technical documentation.
Can't wait to use VisoraReport?
Haven’t signed up yet? Sign up for the free trial of VisoraReport now.
Begin by connecting to your database in VisoraReport Designer. This connection enables you to read, write, and update data directly from your source.
Once linked, you can effortlessly retrieve the data you need to start building your report.
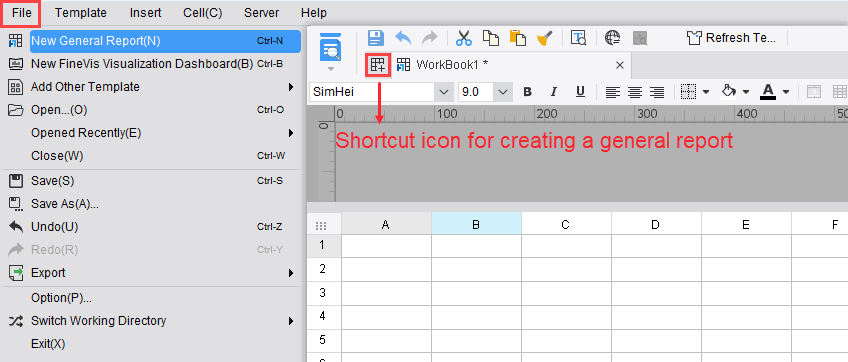
Go to the File menu and select New Report.
Choose Blank Table Report from the available options.
You can also explore the Themed Templates Center to select a pre-designed template that suits your reporting needs.
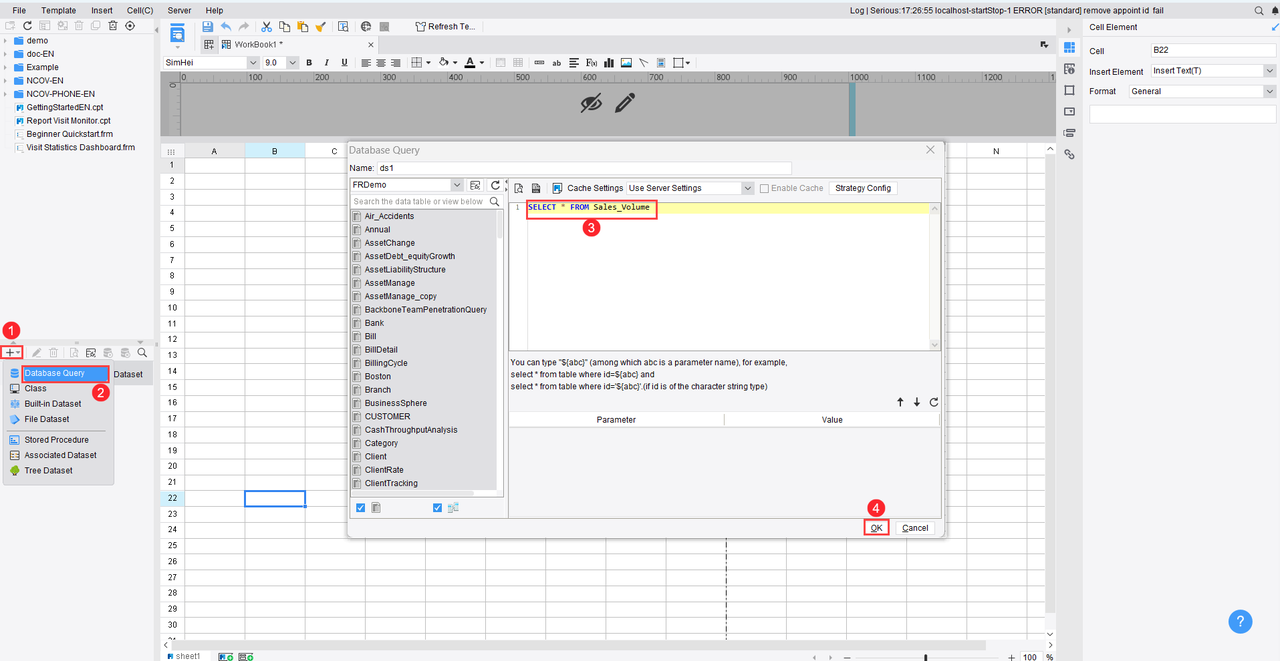
Use SQL queries to retrieve the data required for your report, similar to how it’s done in Navicat.
Once the query execution is complete, the fetched data will be available and ready to use in your report.
Customize the table layout by adjusting styles, formatting, calculations, and filter functions.
The process is similar to working in Excel, but in FineReport, each dataset dynamically expands according to the underlying data structure.
Save the report and click Page Preview to see how it looks on the web.
This guide gives you a basic understanding of VisoraReport. For usage instructions, please refer to the technical documentation.
Russia
Netherland
Vietnam


