
 Russia
  Netherland
  Vietnam


Create Reports
Explore our IT services: innovative solutions, cutting-edge technology, and expert support to transform your business digitally.
- Home
- Create Reports
Create Reports
Overview
How to create reports in VisoraReport?
With VisoraReport, you can design a wide range of report styles using three powerful layout types: Normal Report Layout, Multi-Report Layout, and Dashboard Layout.
- Normal Report Layout: The most widely used design mode in VisoraReport, offering precise control over templates through cell expansion and parent–child relationships. It supports advanced features such as parameter queries, data input forms, and interactive chart components.
- Multi-Report Layout: Combine multiple reports or dashboards within a single interface to enable side-by-side comparison, deeper insights, and comprehensive data exploration.
- Dashboard Layout:Build visually rich, interactive dashboards effortlessly with an intuitive drag-and-drop interface. Dashboards automatically adjust for seamless viewing across mobile, tablet, and desktop devices.
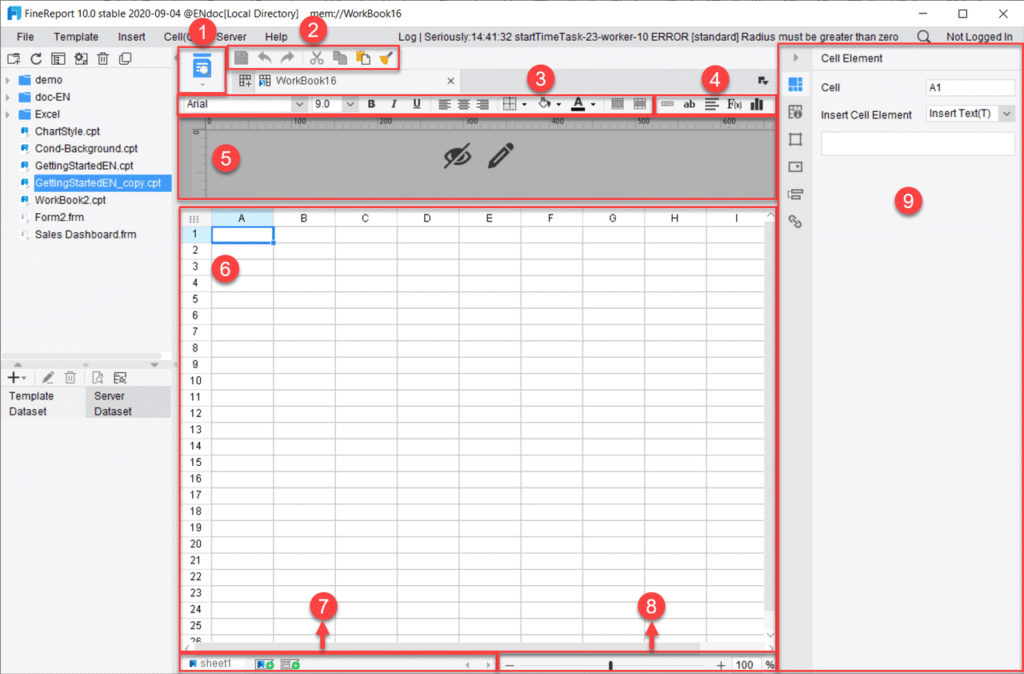
Normal Report Layout
Creating reports with VisoraReport’s Normal Report Layout feels as intuitive as working in Excel—but with far greater power. Unlike static spreadsheets, VisoraReport connects directly to your database fields, enabling dynamic and intelligent data handling. This flexible layout supports the creation of over ten report types, tailored to diverse business requirements.
- Row Reports: Present data in clear, row-based structures for straightforward analysis.
- Cross Reports: Display data in a cross-tab format for quick comparison and insights.
- Grouped Reports: Categorize information for organized and hierarchical analysis.
- Paged Reports: Split extensive datasets across pages to enhance readability.
- Columned Reports: Arrange data into columns for efficient and compact presentation.
- Master-Detail Reports: Pair summary and detailed data for deeper context.
- Word Reports: Export polished reports directly into Word for seamless sharing and documentation.
Multi-Report Layout
The Multi-Report Layout in VisoraReport enables users to combine multiple detailed tables within a single report, making it ideal for presenting complex datasets cohesively.
- Comprehensive Data View: Consolidate financial summaries, production metrics, and order details into one unified display for holistic analysis.
- Organized Structure: Each table highlights key metrics such as revenue, expenses, or performance data, ensuring easy navigation and comprehension.
- Flexible Customization: Adjust table size, design, and formatting to match your organizational or presentation standards.
- Enhanced Clarity: Displaying multiple datasets side by side helps stakeholders quickly connect insights across functions.
- Efficient Communication: Present complete data stories in one place, enabling faster decision-making and improved collaboration.
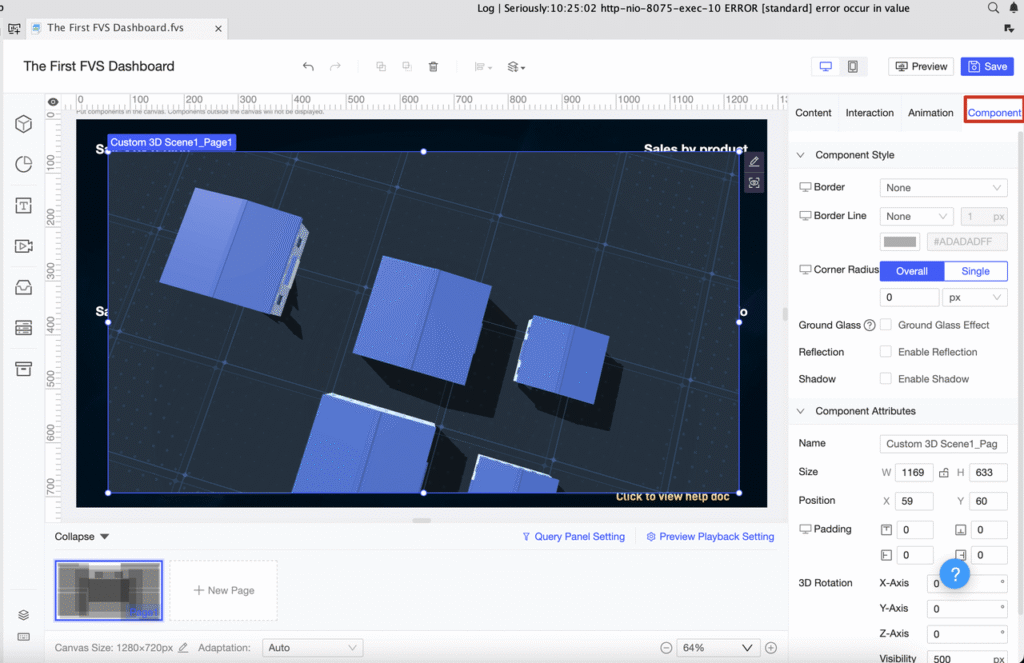
Dashboard Layout
The Dashboard Layout in VisoraReport serves as a dynamic canvas for creating interactive and visually engaging dashboards. Similar to PowerPoint slides, each page can be designed independently for optimal data presentation. With flexible layout options—such as tiled, vertical, horizontal, or full-screen views—you can fully customize the look and feel of your dashboards to deliver clear, compelling insights.
Report Types
Multi-Data Source Report
In VisoraReport, you can define and manage multiple datasets (ds1, ds2, ds3, etc.) within a single report. These datasets can originate from different database tables or even separate databases, allowing you to seamlessly integrate and analyze data from diverse sources in one unified report.
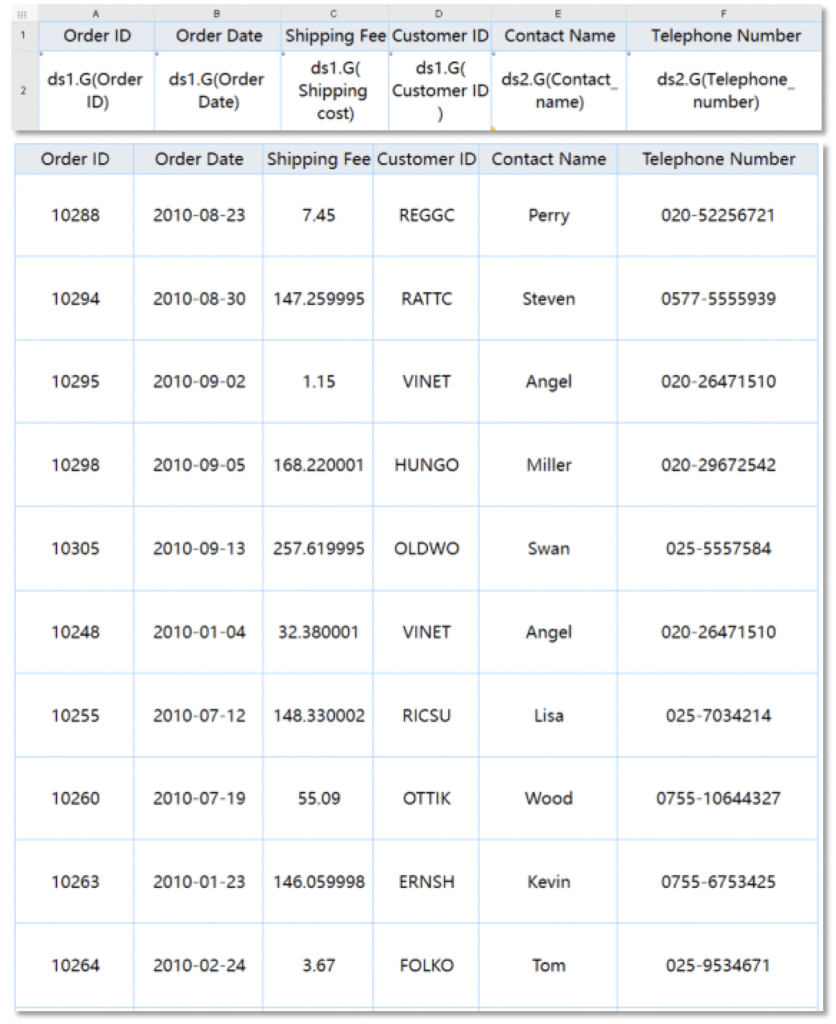
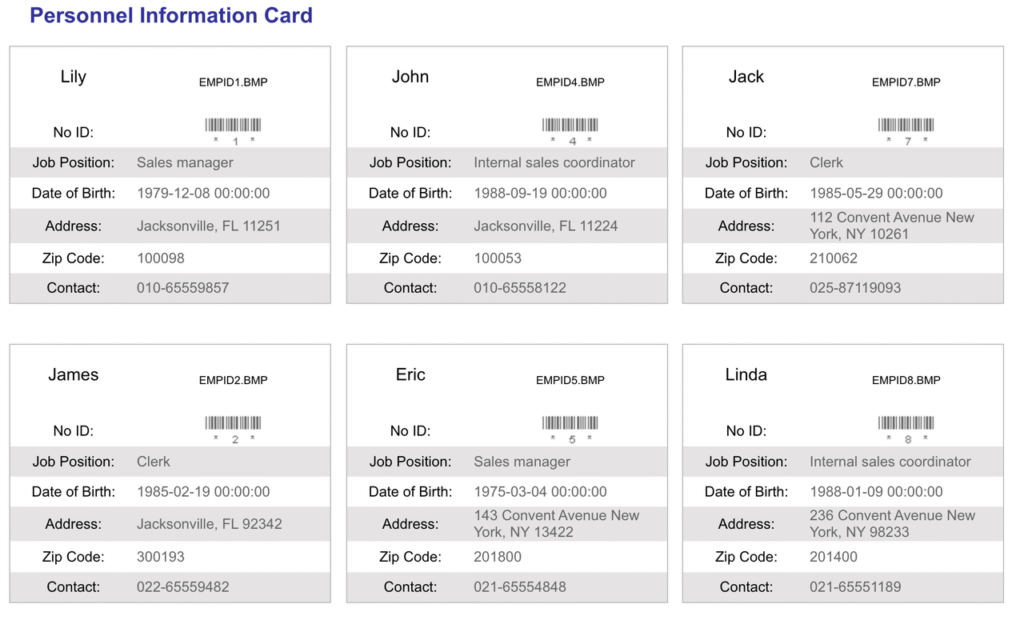
Table Report
Table reports form the foundation of data visualization, and VisoraReport takes them to the next level. Unlike Excel, VisoraReport seamlessly integrates data from multiple databases and tables, allowing you to handle massive datasets effortlessly. As a web-based solution, it also simplifies sharing, collaboration, and real-time data exploration across teams.
Here are some examples of tabular reports:
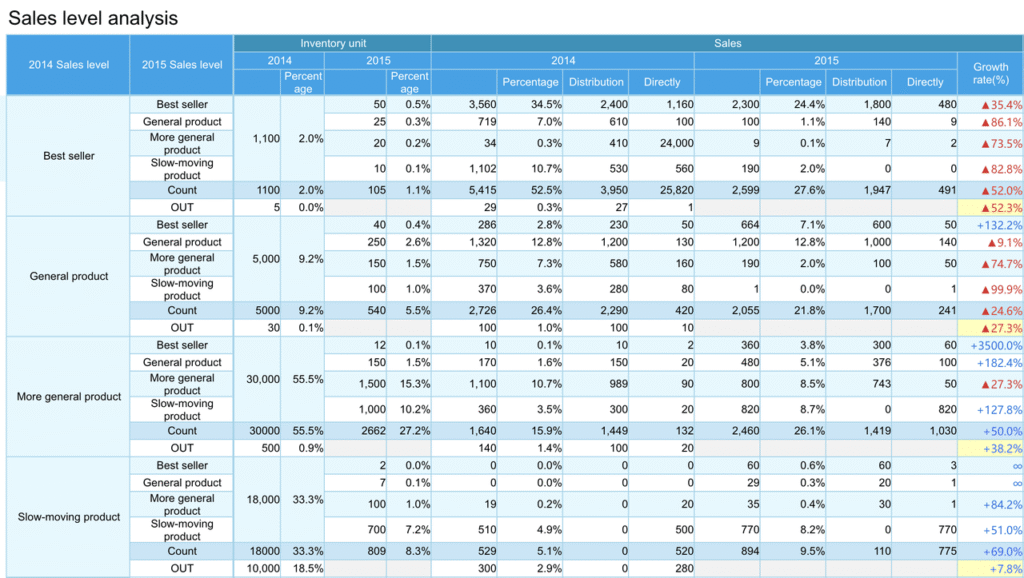
Cross Reports
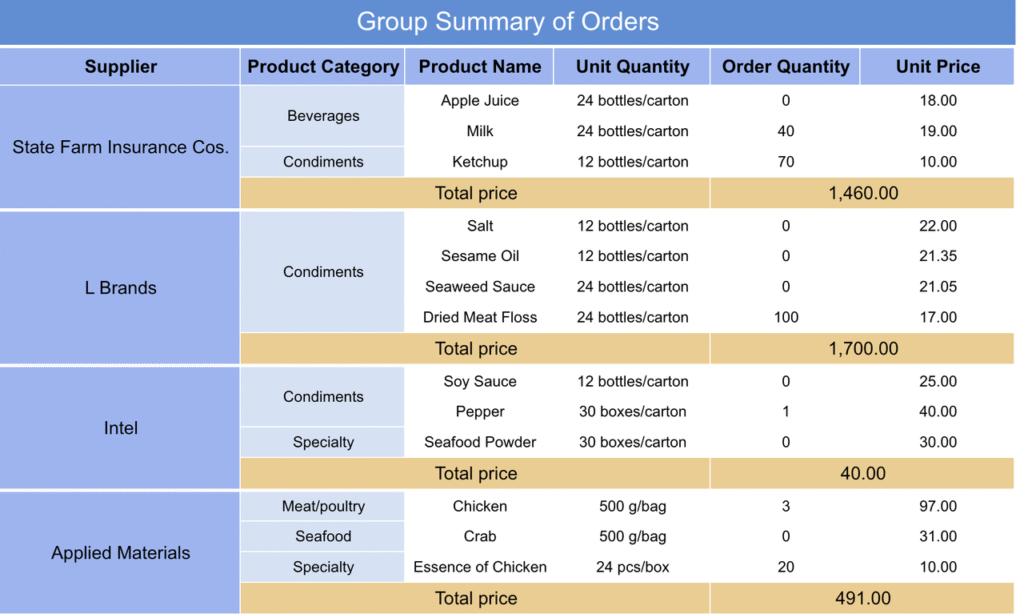
Grouped Reports

Paged Reports
Columned Reports
Inquery Report
An Inquiry Report leverages parameter controls to filter and refine data dynamically. This feature empowers users to interact with datasets in real time—whether running simple queries or configuring advanced, multi-level filters for deeper analysis.
Word Report
A Word Report enables you to generate dynamic, data-driven documents directly within Microsoft Word. With VisoraReport, you can seamlessly embed datasets, parameters, formulas, charts, and tables into your Word files—then fine-tune layouts and formatting with complete flexibility before exporting.
This guide gives you a basic understanding of VisoraReport. For usage instructions, please refer to the technical documentation.