
 Russia
  Netherland
  Vietnam


Create Dashboards
Explore our IT services: innovative solutions, cutting-edge technology, and expert support to transform your business digitally.
- Home
- Create Dashboards
Create Dashboards
Overview
What is a dashboard in VisoraReport?
VisoraReport provides an interactive data dashboard that unifies key metrics from multiple data sources. With an intuitive drag-and-drop interface, you can easily design dashboards featuring dynamic charts, tables, and visual components to monitor business performance and trends in real time.
Seamlessly integrate data from multiple databases and reports with VisoraReport to gain a unified, comprehensive view of your business information. Customize every aspect of your dashboard layout and drill down into detailed datasets for deeper insights. With its intuitive design, VisoraReport makes it effortless to create engaging, interactive dashboards that help you explore and harness your data effectively.
What are the differences and advantages?
VisoraReport sets itself apart through a suite of advanced features that redefine your data visualization experience:
- Immersive 3D Visuals: Bring your data to life with built-in 3D components that turn complex information into visually compelling, easy-to-understand graphics.
- Dynamic Animation Effects: Engage your audience with smooth, presentation-style animations similar to PowerPoint, adding motion and energy to your insights.
- Responsive Across All Devices: Enjoy a fully adaptive design that looks exceptional on desktops, tablets, and smartphones, ensuring seamless accessibility anytime, anywhere.
- Effortless Drag-and-Drop Design: Build and customize reports effortlessly with intuitive drag-and-drop functionality—no technical expertise required.
Common Dashboard
VisoraReport Common Dashboard is a powerful business intelligence tool that centralizes critical KPIs and performance metrics to help you make data-driven decisions with confidence.
- Sales Performance Tracking: Monitor sales growth, conversion rates, and team performance in real time to identify trends and optimize strategies.
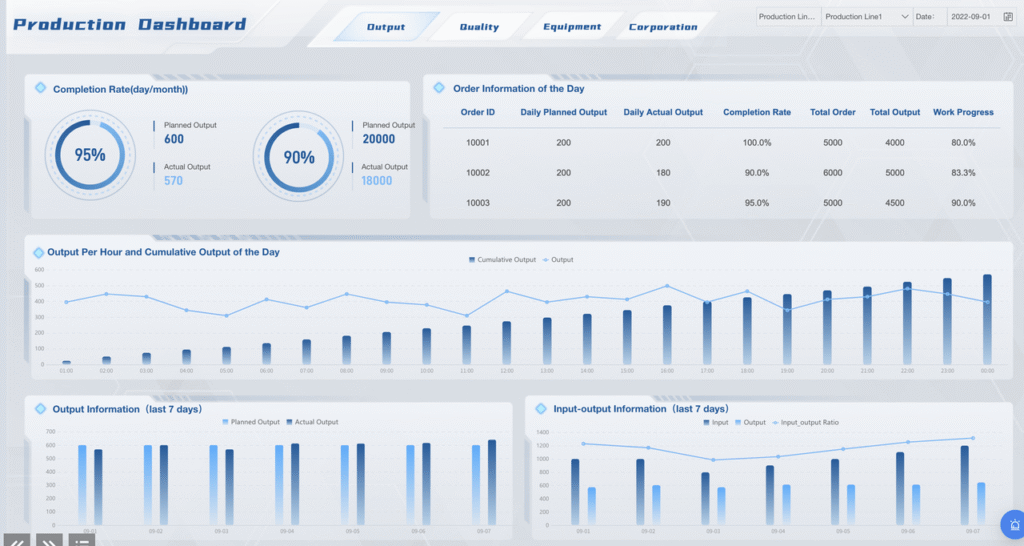
- Operational Visibility: Gain a comprehensive view of production efficiency, inventory flow, and resource usage to streamline operations.
- Customer Insights: Consolidate customer engagement and satisfaction data to better understand behavior and enhance customer experience.
- Financial Control: Track budgets, expenses, and revenues seamlessly to ensure transparency and smarter financial planning.
- Project Management:Stay on top of project milestones, progress, and resources to keep teams aligned and projects on schedule.
3D Dashboard
VisoraReport 3D Dashboard brings data to life with immersive visualizations that drive smarter decisions across industries like smart cities, factories, logistics, and water management. By presenting complex datasets in three dimensions, it enables leaders to analyze and act with precision. In smart city applications, the dashboard provides real-time visibility into factors such as population density, traffic flow, and public safety. This 3D perspective enhances infrastructure planning, streamlines operations, and supports rapid responses to emerging challenges—transforming raw data into actionable intelligence.
In smart factories, the VisoraReport 3D Dashboard delivers deep insights into production lines, equipment performance, and operational efficiency. By identifying bottlenecks and visualizing workflows in real time, it helps manufacturers optimize processes and reduce downtime. With instant access to quality metrics, resource utilization, and energy consumption data, you can make informed, data-driven decisions that enhance productivity and support sustainable operations.
In smart logistics, the VisoraReport 3D Dashboard enables real-time tracking of shipments, route optimization, and fleet performance monitoring. This helps organizations streamline operations, reduce transportation costs, and improve delivery efficiency. In smart water management, it visualizes water distribution networks, monitors usage patterns, and detects infrastructure issues, empowering teams to ensure sustainable and efficient resource management.
Overall, VisoraReport’s 3D Dashboard provides a comprehensive platform to visualize operational processes, analyze real-time data, and enhance decision-making efficiency.
This guide gives you a basic understanding of VisoraReport. For usage instructions, please refer to the technical documentation.