Empower every user to explore, analyze, and visualize data with ease. Build interactive dashboards, discover insights, and make smarter decisions—all in one intuitive, zero-code analytics platform.
Empower every user to explore, analyze, and visualize data with ease. Build interactive dashboards, discover insights, and make smarter decisions—all in one intuitive, zero-code analytics platform.
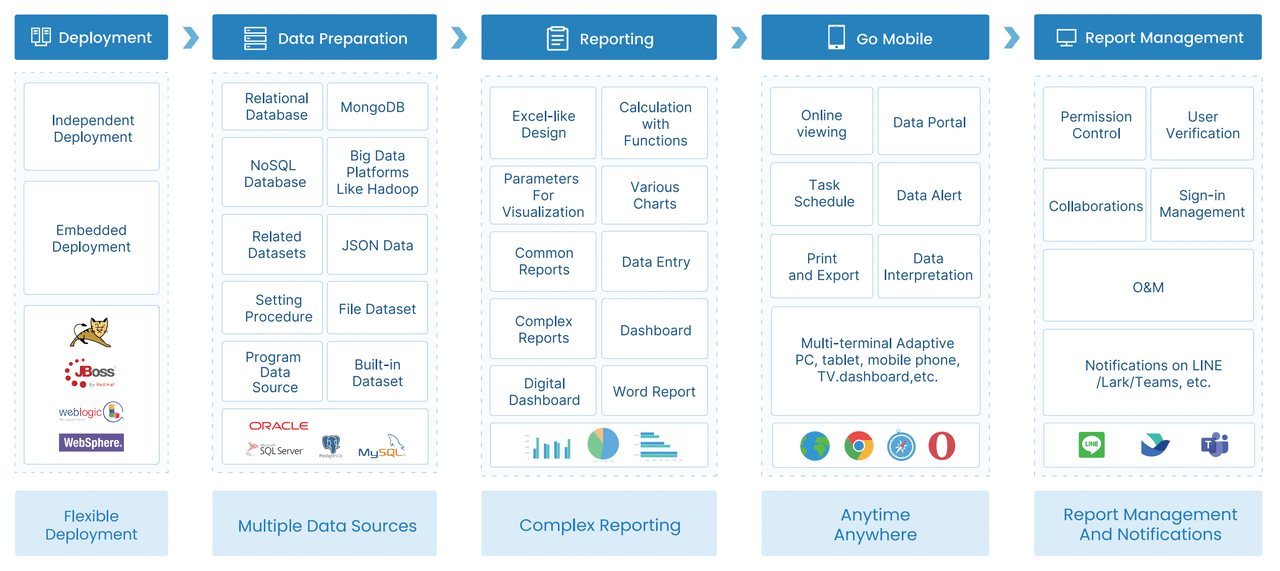
VisoraReport’s workflow is structured into five key stages: Installation & Deployment, Data Preparation, Report Creation, Report Distribution, and Report Management. Developers design reports and dashboards, which are seamlessly shared with business users and managers for analysis, querying, exporting, and printing.
VisoraReport includes two core components — Report Designer and Report Server. The Report Designer enables you to create dynamic, customizable reports, while the Report Server ensures efficient management and distribution.
With VisoraReport, you get the power of two integrated solutions — the Report Designer for building flexible, data-driven reports, and the Decision-Making Platform for centralized report management, visualization, and user control.
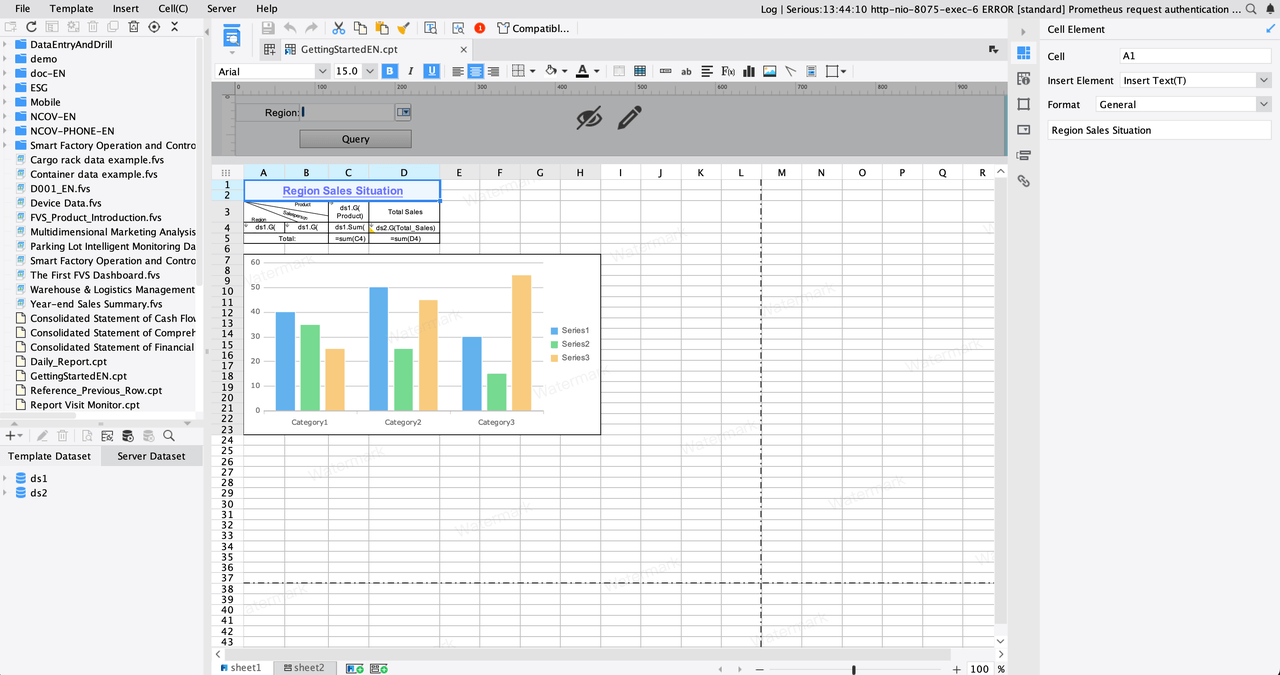
Report Designer
VisoraReport’s designer interface offers an intuitive, Excel-like experience with a familiar menu layout, control panel, and styling options. Unlike Excel, which processes data directly, VisoraReport works with datasets built from data tables and fields. Creating reports is effortless—simply bind data columns to cells without writing a single line of code.
VisoraReport’s Decision-Making Platform serves as a centralized hub for all reports and dashboards, providing seamless integration and visualization. It also functions as a powerful management console, handling user accounts, access permissions, system operations, and data security. Each module is designed with precision, enabling teams to manage and analyze data efficiently within a secure, unified environment.
This guide gives you a basic understanding of VisoraReport. For usage instructions, please refer to the technical documentation.
Duis consequat libero ac tincidunt consectetur. Curabitur a magna sit amet orci mollis vehicula. Morbi at enim a ex mollis sodales ut eu elit. Quisque egestas.

 Russia
  Netherland
  Vietnam