Empower every user to explore, analyze, and visualize data with ease. Build interactive dashboards, discover insights, and make smarter decisions—all in one intuitive, zero-code analytics platform.
Empower every user to explore, analyze, and visualize data with ease. Build interactive dashboards, discover insights, and make smarter decisions—all in one intuitive, zero-code analytics platform.
Introducing VisoraChatBI: Conversational Analytics Made Easy
VisoraBI just got even smarter.
Meet VisoraChatBI, a powerful new module within FineBI that brings conversational AI to business intelligence. Built to lower the barrier of data access, FineChatBI empowers users—from business leaders to front-line staff—to ask questions and get trusted answers from data, all in plain language.
Whether you’re checking last quarter’s sales or drilling into customer retention trends, FineChatBI makes data interaction as simple as chatting. It sits on top of FineBI’s robust analytics engine, meaning every response is backed by governed, up-to-date data from your enterprise sources.
To see how VisoraChatBI works in action and the value it brings, check out the demo below:
Why FineChatBI?
While VisoraBI offers drag-and-drop analytics, VisoraChatBI takes usability to the next level. It helps:
Executives make fast, informed decisions without dashboards.
Business analysts validate assumptions instantly without switching tools.
Sales or operations teams get on-the-spot answers to drive real-time actions.
VisoraChatBI reduces dependency on technical skills and accelerates the path from question to insight.
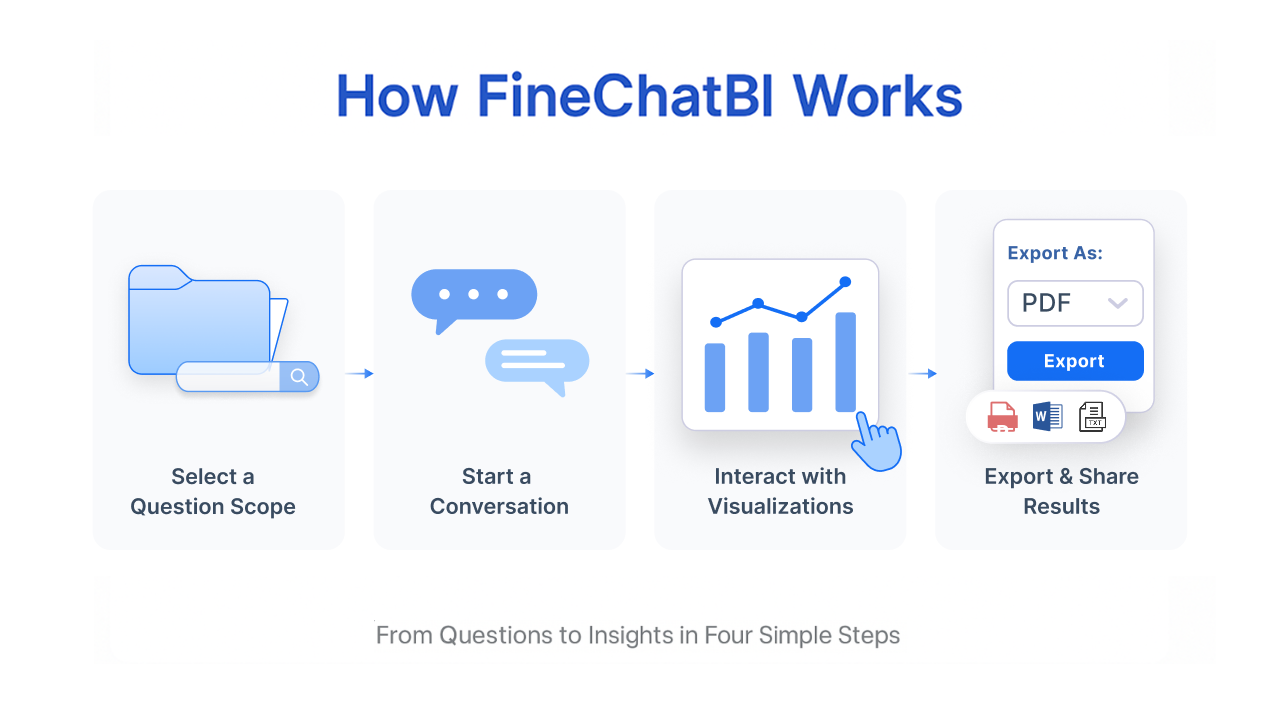
How FineChatBI Works – From Questions to Insights in Four Simple Steps
VisoraChatBI transforms how business users interact with data—no complex tools, no technical barriers. Just natural language and real-time insights. Below is a quick look at how it works in four simple steps:
1. Select a Question Scope
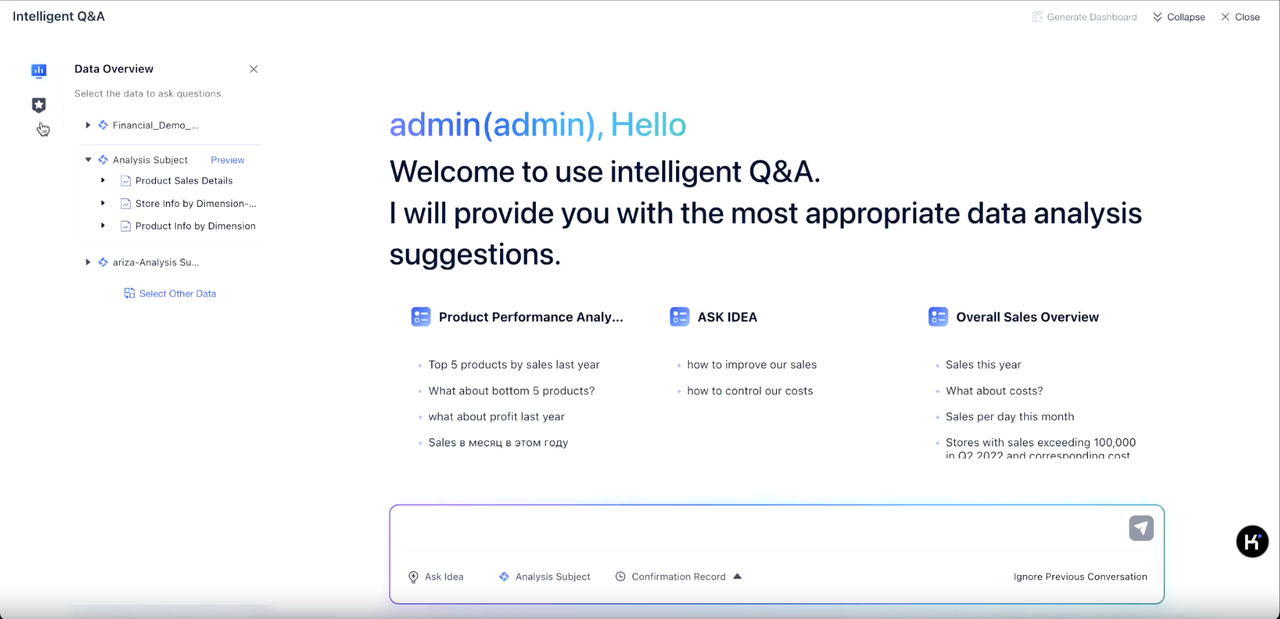
Jump into VisoraBI and click the “VisoraChatBI” button to start. Users can either ask questions about preloaded datasets prepared by IT or choose specific topics from the left navigation bar for custom queries. Previewing data ensures you’re selecting the right theme.
2. Start the Conversation
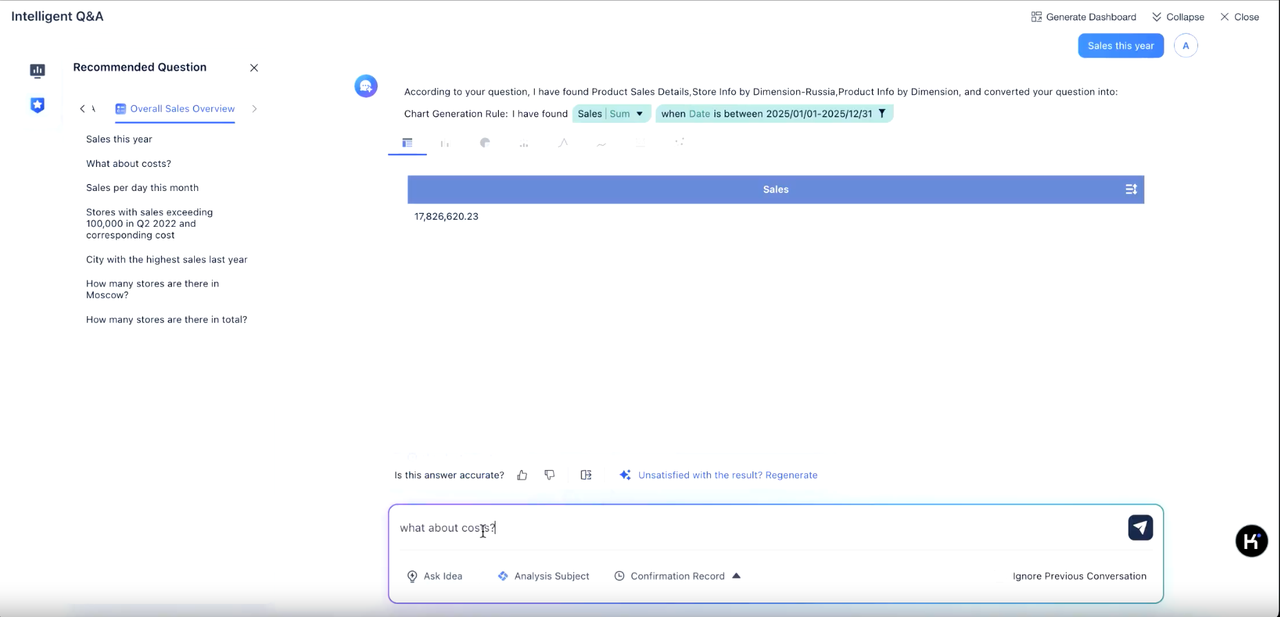
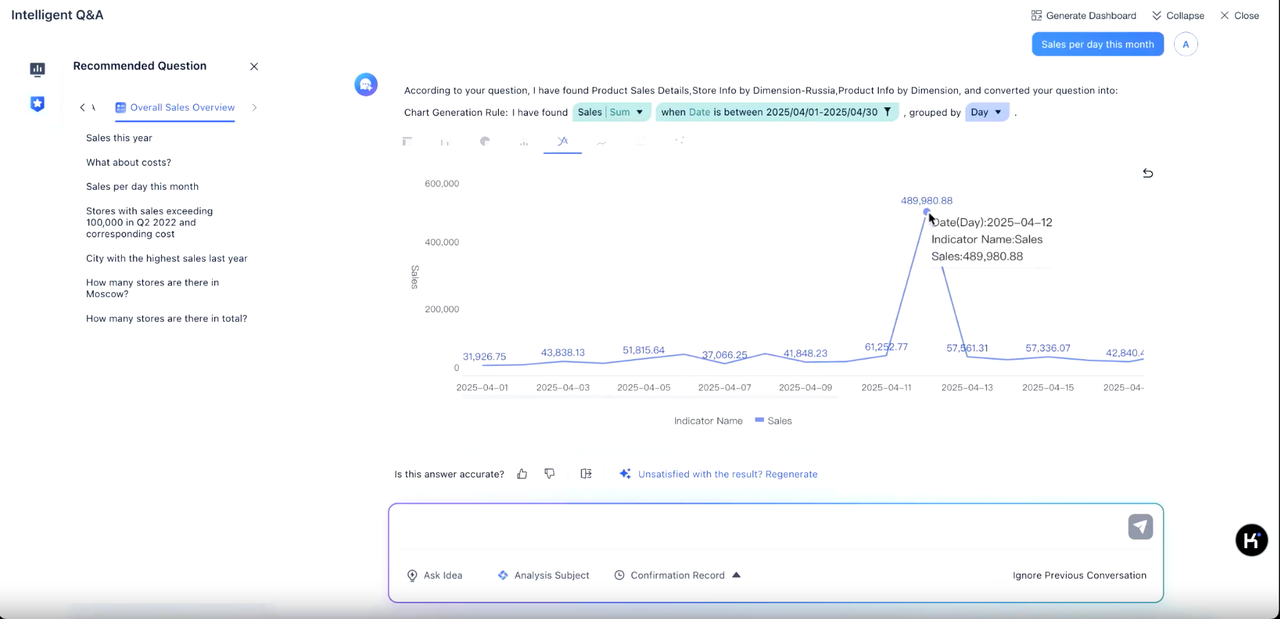
Ask questions in plain language like “What about this years’s sales?” VisoraChatBI understands your intent, disambiguates themes and fields, and generates answers instantly. Multi-turn conversations are supported, with contextual understanding and smart rewrite suggestions if needed. Each response is accompanied by a breakdown of data sources, filters, and logic for full transparency.
3. Interact with Visualizations
VisoraChatBI doesn’t just answer—it visualizes. Easily switch chart types, drill down for deeper analysis, or apply attribution analysis to uncover key drivers. With data interpretation, trend forecasting, and smart follow-up suggestions, you can go beyond what happened to why it happened—and what to do next.
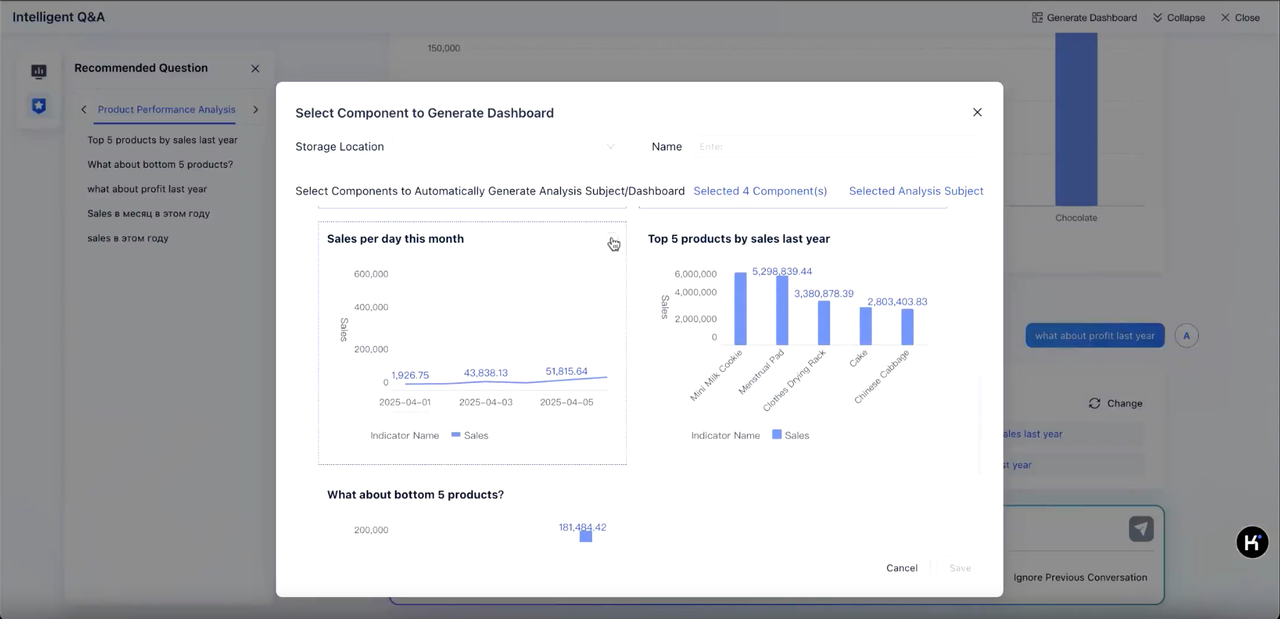
4. Export and Share Results
Insights don’t stay in the chat. Export results as Excel or images, or click “Generate Dashboard” to save key visualizations. The saved dashboard includes the data, model, and charts used during the conversation—ready for further exploration within VisoraBI.
👉 To see how VisoraChatBI works in action and the value it brings, check out the demo above.
VisoraBI + VisoraChatBI = BI for Everyone
Together, VisoraBI and VisoraChatBI bring the best of self-service and simplicity. Whether you prefer visual exploration or conversational querying, your team can now choose the most intuitive way to make data-driven decisions.
Experience the future of BI—start your trial today.
Duis consequat libero ac tincidunt consectetur. Curabitur a magna sit amet orci mollis vehicula. Morbi at enim a ex mollis sodales ut eu elit. Quisque egestas.

 Russia
  Netherland
  Vietnam